
Delivering Information Architecture
One of the greatest challenges in digital design is identifying and maintaining focus on the right problem. The temptation to spend energy on problems that are urgent (but not important), interesting (but not impactful), or easy (but not relevant) is difficult to avoid—and sometimes even difficult to detect.
For information architecture, such misplaced focus can lead to a range of problems. I’ve come across clients who end up with an expensive, full function CMS of which they’re only using the most basic features and capabilities because their information layer is a mess. Or clients who migrated to a new platform (with a shiny new visual design) which worked well for a year or so, but as they added content and adapted to market conditions, the structure crumbled and now customers can’t find anything. And, of course, we’ve all seen—or been the victims of—intranets put together by some well-meaning colleague who, despite their best intentions, ended up creating a reviled object of misery and loathing.
Though problems such as these stem from a series of interrelated circumstances and decisions, the shared thread that runs through them is an underestimation of the scope and impact of information architecture. This is a common result when practitioners and teams focus on the arrangement of resources and functionality, but ignore the method of arrangement that generates that final result.
The beguiling light that leads us into this dark corner of despair is, all too often, the most ubiquitous of IA deliverables: the visual sitemap. In this article we’ll examine why this happens, explore what practitioners and teams can do to avoid this trap of misplaced focus, and learn how to rehabilitate our wayward sitemaps and reinstate them as the effective design artifacts they can be.
Devils, Details, and Sitemaps
In his whimsical 1975 systems engineering treatise, systems theorist John Gall writes that “a complex system that works is invariably found to have evolved from a simple system that works.”
Most websites today are indisputably complex systems. This is clearly the case with sites running on enterprise CMSs and connected to integrated commerce, tracking, and analytics tools. Even for sites that are built on much simpler code bases, however, we must still negotiate the needs of users, the goals of the business, and the opportunities and constraints presented by the underlying technology.
There is a wide—and ever growing—variety of tools and techniques at our collective disposal for working through these complex systems. In spite of (or perhaps because of) this expansive toolkit, the IA deliverable that most resonates with clients, and the only one which, as a fairly well-seasoned IA, I am ever regularly asked to produce, is the visual site map.
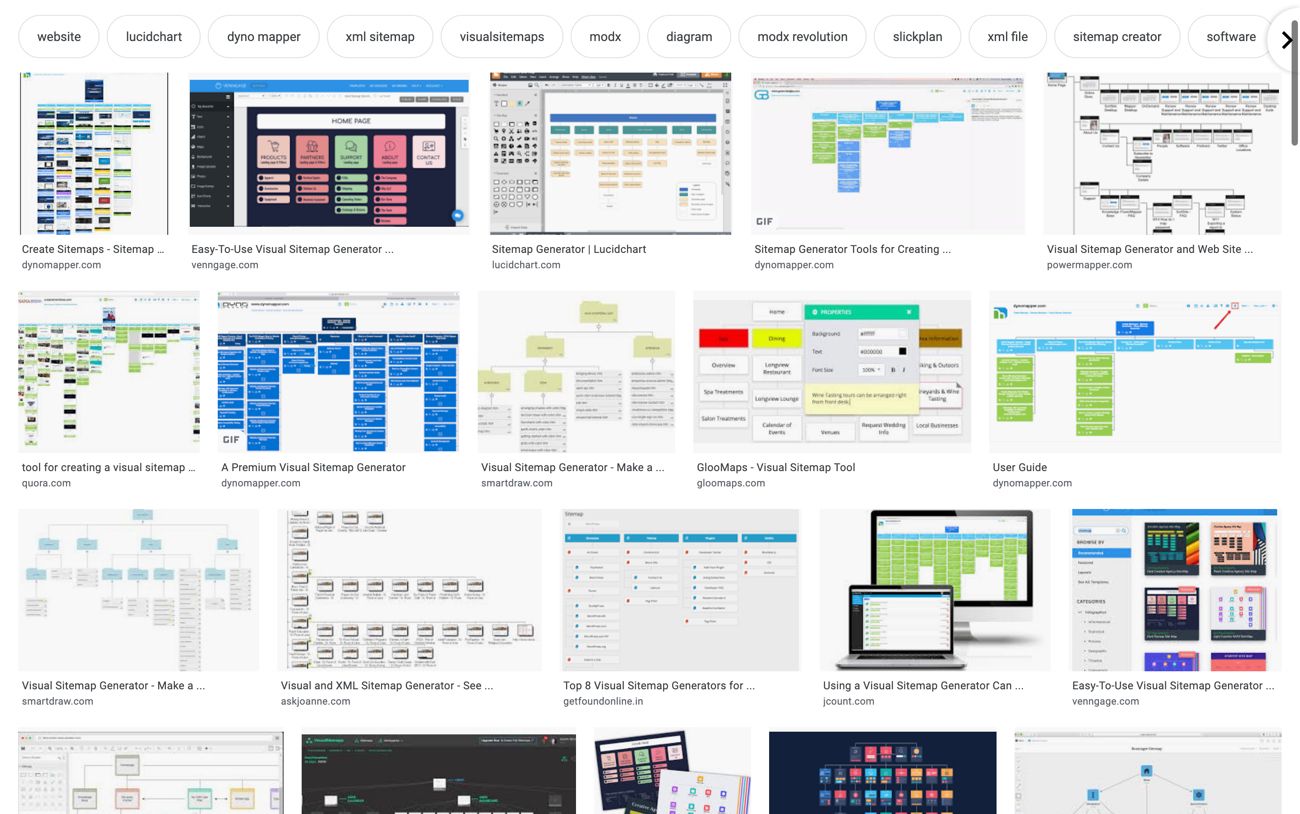
Visual sitemaps are the “org chart” styled diagrams that are often used to communicate website hierarchy, navigation, and sometimes even layout and template specifications. Though framed in the early literature as just one element of the well-rounded IA practitioner’s toolkit, visual sitemaps have recently begun taking on a life of their own. In the last couple years, for instance, there has been a dramatic uptick in visual sitemap SAAS tools designed specifically to speed up—and in some cases automate—the site map diagram creation process. (Claims one: “Create your visual sitemap on the go—easy peasy!”)
The appeal of visual sitemaps is easy to understand. Organizations love org charts (and why not? they’re essentially “selfies” for corporations), and visual site maps are based on the same diagrammatic model. Visual sitemaps provide a flat, simplified model of what a website, intranet, or application looks like from the home page at a given point in time. This affords a perspective from which even the most technologically unsavvy stakeholder or team member can offer feedback, suggestions, and critique. Visual sitemaps feel important and impactful, and, as their completion usually marks the point in a project when development can get started, they certainly feel urgent.
When we break down the design decisions that a visual sitemap represents, however, we can see clear evidence of the complex interplay of a number of underlying systems. Here, for example, is a site map I created for the University of Washington in 2011:

As far as sitemaps go, this one’s fairly simple. It still, however, represents at least four distinct systems that must interoperate predictably and reliably in order to create an effective and sustainable website:
- classification
- navigation
- global layout
- page type
Some of these systems, such as page type, are usually worked through in greater detail elsewhere in the design process. Too often, however, the site map is the centerpiece of discussions about categorization, classification, prioritization, arrangement, and navigation. This forces us to attempt to make decisions about making the complex system work, as opposed to focusing on how to make sure the simple systems work.
This is a problem. For the rudimentary site map above, for instance, there are at least 15 points of overlap between the four systems it represents:
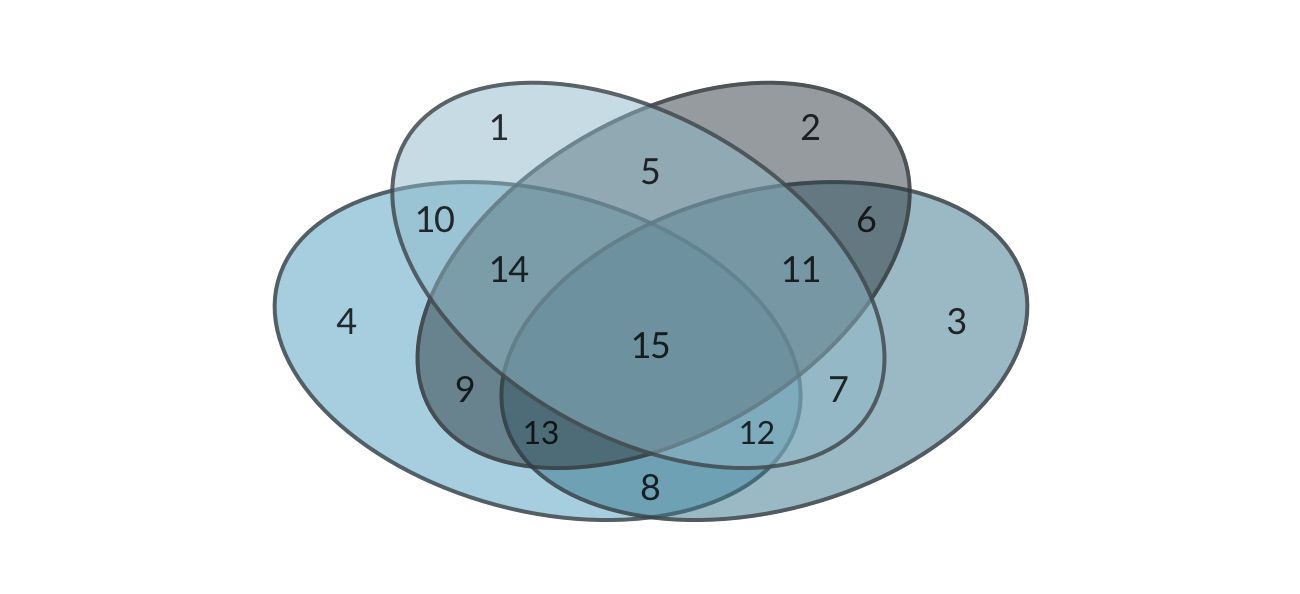
This is a lot to take in even for sharp people on a good day—and that’s if you can get your team’s and stakeholders’ time and attention for long enough to explain it.
Because sitemaps are poor vehicles for evaluating whether the simple systems that make up a website are working as intended, what we often end up discussing is the arrangement of the pages we see, as opposed to the decisions, priorities, and rules that define the methods for arranging them. We substitute a discussion about the important, impactful, and relevant details of how the information design and delivery system works (or should work), for an urgent, interesting, and easy conversation about whose section has a link in the global nav, or where individual pages will “live” on the new site.
This feels like design, but from a systems point of view, all we’ve done is take a snapshot of the machine at rest, from the outside. In these cases, we only see how the system actually works after it’s been built and is working for—or failing—our customers and business.
Creating Simple Systems That Work
The problem with making mission critical decisions about a complex system as a whole is that we’re lousy at understanding and evaluating systems in detail. The solution to this frustrating state of affairs is evident in Gall’s law: if a complex system that works is invariably composed of simple systems that work, we must ensure that the simple systems that come together to make our complex system work as we intend them to. (Implicit here is a corollary I’ve formulated to Gall’s Law: All systems “work”; they just don’t always work as we intend them to.)
When it comes to designing information systems for use online, the Web’s underlying technologies can help us isolate these “simple systems.” The 1994 RFC defining URLs, for instance, describes the hierarchical nature of URL schemes and outlines the fundamental way that meaning is created with structure on the web. The RFC describing Hypertext Markup Language likewise defines the primary way that HTML documents and other resources are linked and accessed on the web.
These fundamental building blocks give us a way to consider the smaller systems that combine to create a holistic information architecture approach—in this example, classification (as defined by URL directory structure) and navigation (as defined by purposeful systems of hyperlinks). By focusing on these smaller operational components, we can work to ensure that these simple systems work as we intend by using a principled, standards-based approach to interrogate, understand, and optimize them in order to better meet user and business goals within the context of the technology and resources available to us.
Let’s look at an example of how this works in practice. I recently helped an international technical consulting firm consolidate two independent and distinct websites into a single, cohesive web presence that would serve their customers worldwide. I can’t share the actual work I did for this client, but I did use it as the real-world inspiration for a fictional consulting company that I can discuss: Aldrin Lunar.
“Aldrin Lunar” is an extra-planetary exploration and stewardship consultancy. They help companies in the emerging field of private sector space exploration make sound business decisions around strategy and technology. Up until this year, they had actually been two companies—Aldrin Astronautics and Lunar Strategies International—who often worked in close association, but maintained separate brands (and websites). They hired me to help them consolidate their websites into a single, cohesive experience for their clients and potential clients worldwide.
Classification Scheme
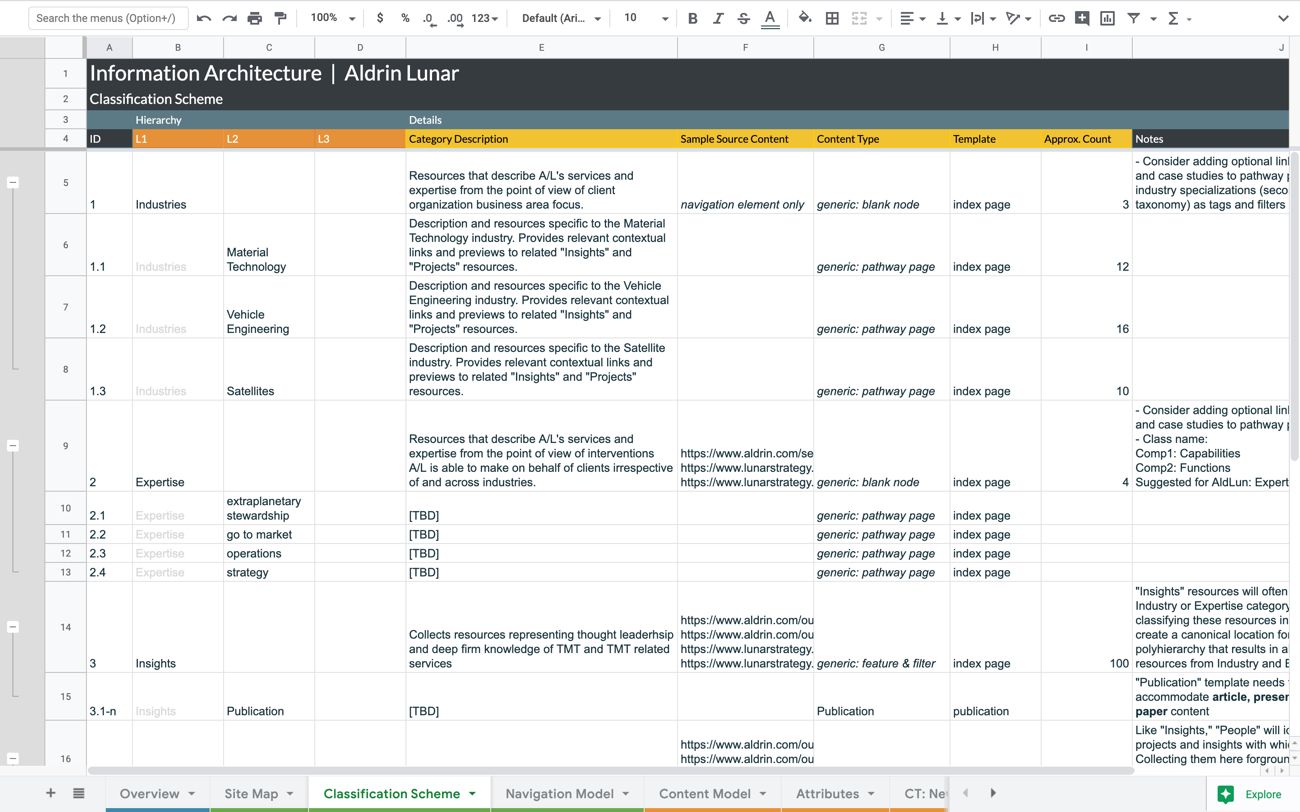
One of the core deliverables I created for Aldrin Lunar is a classification scheme. Classification schemes define, order, and establish rules for a digital property’s core system of classification. Classification is how a website communicates meaning in the way content is organized to users and to search engines. The choice and relationship of categories tells a story about a brand, a collection of content, and an organization’s priorities and values.
In order to define a classification scheme that would meet Aldrin Lunar’s business goals, effectively serve their users, and reflect their unique skills and values, I used a principled, standards-based process to design, iteration, and documentation.
A “principled” approach to design works to ensure that evidence and the interpretation of evidence gathered in discovery and research phases aligns with and supports classification recommendations. In the case of Aldrin Lunar, we used the warrant principles to ensure that the categories chosen and the labels assigned to them were justified by the evidence we had gathered in research and discovery phases:
- Literary warrant: the classification method recommended must be based only on the specific resources being classified
- Scientific warrant: only those categories recognized by experts in the domain should be used in the classification system
- User warrant: categories and descriptive terms should be chosen according to their frequency of use by everyone—not just domain experts
Even from this short list it is clear to see that any given set of principles will often conflict. This is what makes this a design process, as opposed to simply a rote application of rules. By framing discussions of classification in terms of warrant principles, we were able to keep our conversations—and decisions—based on the needs of priorities of users and the business.
This alone, however, isn’t enough to ensure that the system of classification works as intended. We also needed a set of standards to guide the framing of our findings and recommendations. Classification, when done right, feels “obvious,” which tends to create the impression that formulating it should be equally obvious. The astounding number of confusing, poorly organized websites (and intranets) makes a strong argument that this is not the case. To create a classification system that works as intended, and reflects Aldrin Lunar’s unique business and services, we needed to ensure that it conforms to the ways that humans of varying skill levels process linguistic terms, categories, and relationships.
This is where standards help to inform our design. Published standards represent the distilled wisdom of subject matter experts worldwide. They help to ensure that a design solution meets accepted interoperability and compatibility standards, but more than that, they allow assiduous practitioners to introduce top level expertise to a project of any size (or budget).
For Aldrin Lunar we used ISO/IEC 11179-3 - Registry Metamodel and Basic Attributes and ANSI/NISO Z39.19 - Guidelines for the Construction, Format, and Management of Monolingual Controlled Vocabularies to inform our creation of a set of categories—and rules for how those categories operate and evolve—that provides a stable, predictable foundation for the website. Because it is designed as a system for arranging resources based on business and user needs, as opposed to a single arrangement of current resources, it is able to flex and grow as the needs of the company and its customers change over time.
Navigation Model
A navigation model represents a recommended navigation scheme and labeling system for a website or application. In the same way that the classification scheme corresponds to the underlying web technology of URLs, the navigation model corresponds to the way the web is connected via links, the “hypertext” in HTML.
For Aldrin Lunar, this includes documenting the site’s primary and secondary global navigation, global footer navigation, and category-specific primary local navigation.
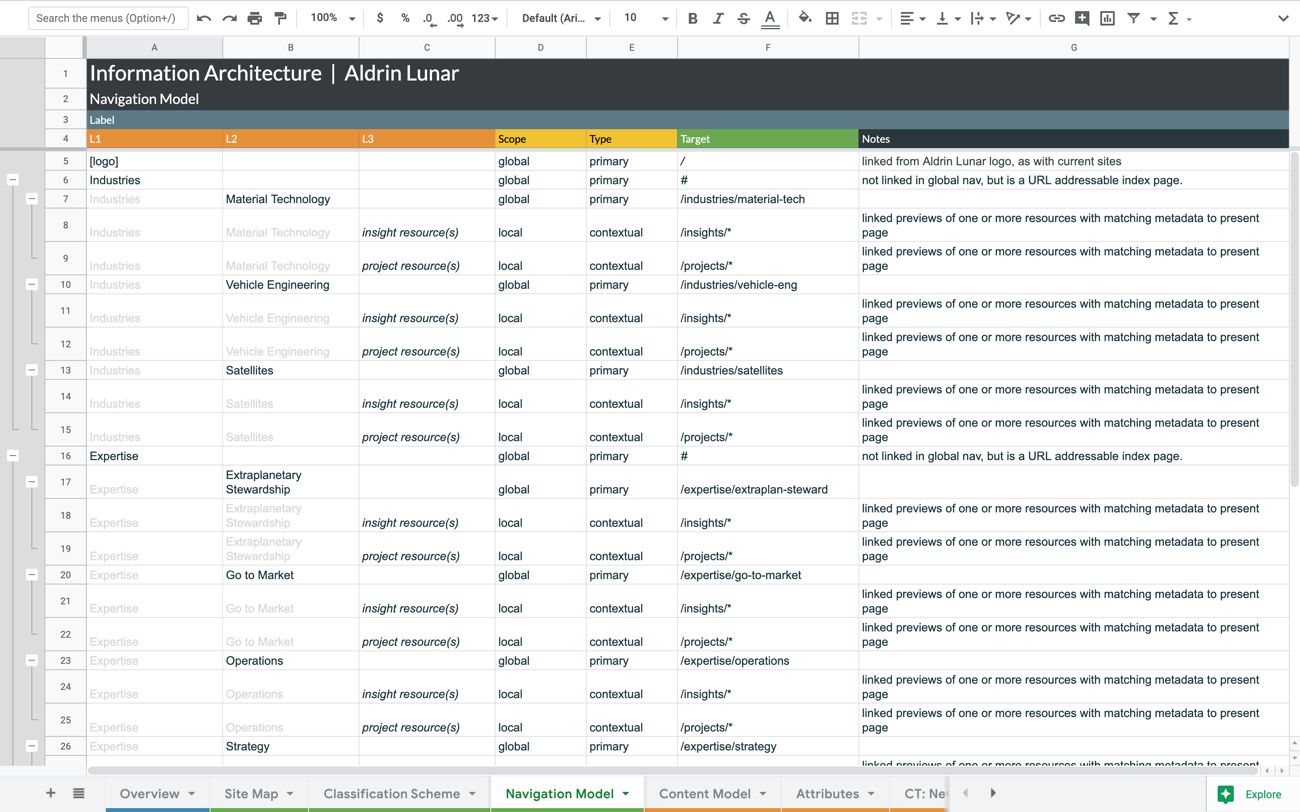
You may be surprised that the navigation model is documented in a spreadsheet, as opposed to being mocked up as part of an interface in a wireframing or drawing tool. This is an explicit choice: by stripping navigation down to its constituent elements—link, label, grouping, and order—we can evaluate and optimize the simple system that is later combined with graphic user interface elements to create a more complex system. This means that our information architecture can give UX and UI designers a solid, functional foundation on which to build, but without locking them into interface choices.
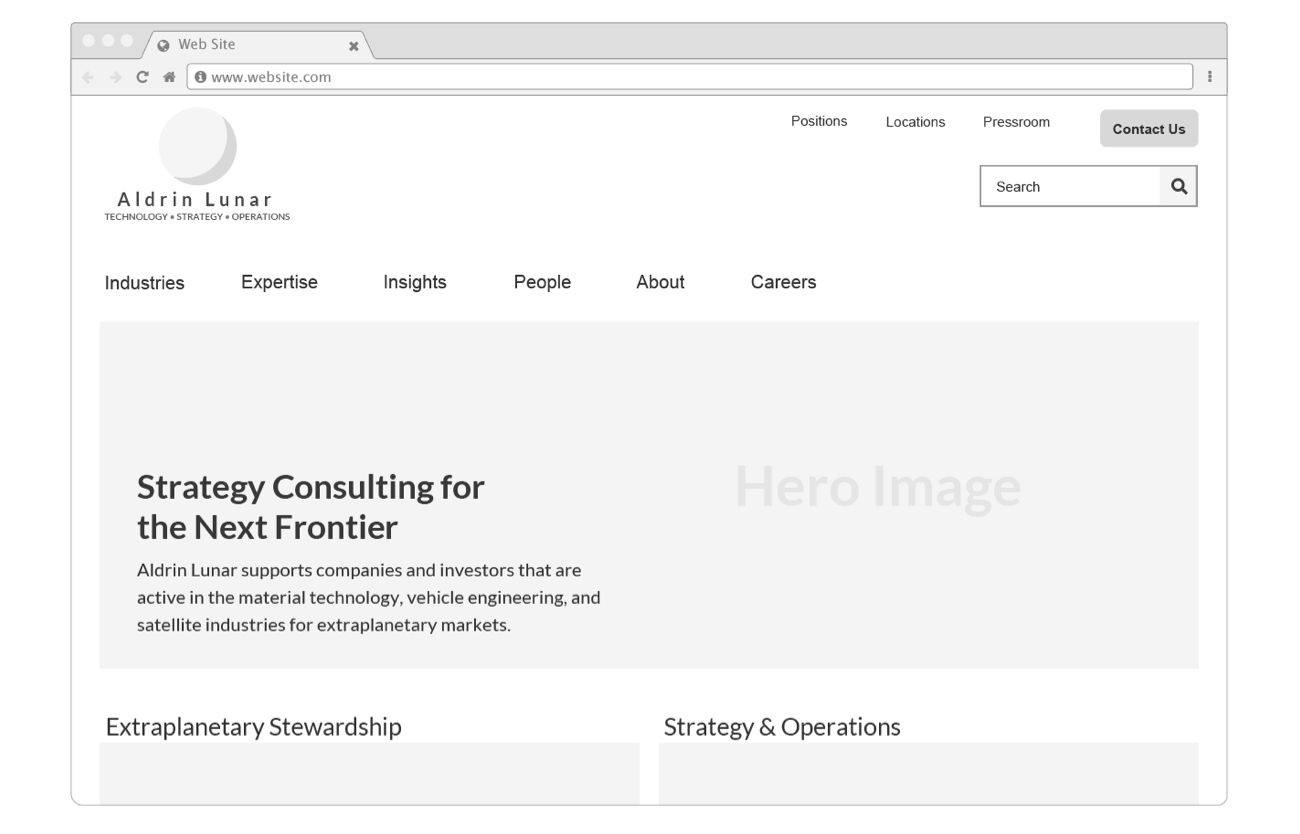
Translating a navigation model across form factors offers an example of why this is important. On desktop/laptop screens, for instance, one common way to communicate to site visitors that a global menu is “secondary” is to format it in smaller type, and place it close to the top edge of the screen.
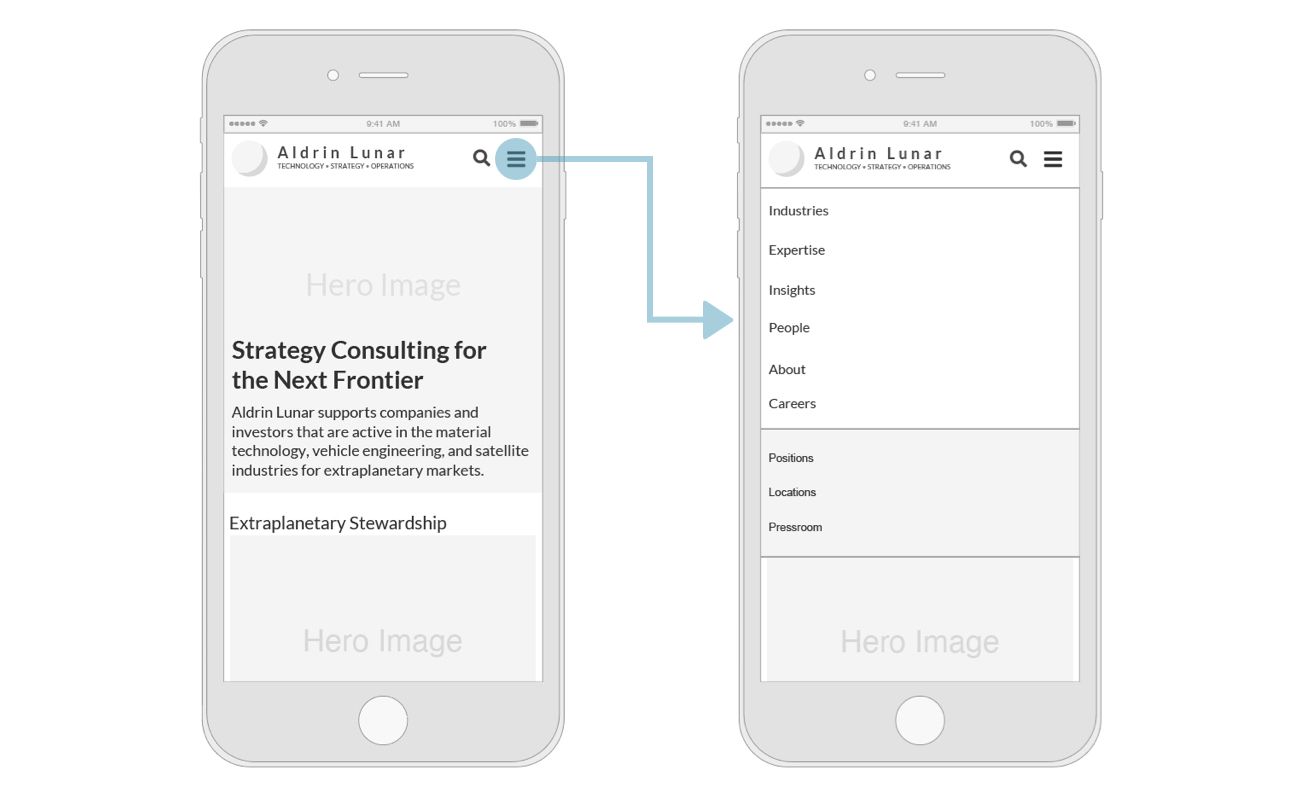
On mobile, however, that same menu is placed below primary global navigation to communicate that it is secondary, and the type size of both menus is closer together to support better mobile usability.
These are not differences in the navigation model; they’re differences in how that model is expressed consistently across contexts. By designing the navigation model first as a system bounded by the core technologies of the web (hypertext), we better our chances of starting with a simple system that works, before compounding its complexity by combining it with other systems.
As with the classification scheme, we can use a principled, standards-based process to design, iterate, and document navigation. The warrant principles we looked at earlier apply to navigation design, but since navigation focuses more heavily on the idiosyncrasies of potential site visitors across sometimes very different user groups, we’ll also want to incorporate principles that take into account the sometimes quirky nature of human perception and comprehension.
The Gestalt principles of form perception translate in some important and useful ways to information design. The law of similarity, for instance, applies to word forms for labels. Imperative word forms like “shop,” “learn more,” and “sign up” form a conceptually distinct group, as opposed to declarative word forms like “news,” “events,” and “services.”
The gestalt law of common fate, likewise helps make the case that link targets in a distinct menu should behave the same. When five of six global navigation links lead to on-site landing pages, but the sixth takes you to a different website altogether, the effect is jarring. This isn’t to say that this could never be done. Understanding and optimizing navigation at a conceptual level prior to interface design, however, allows you to work through the fundamental behavior of this simpler system first, and to ensure that the result is what you intend.
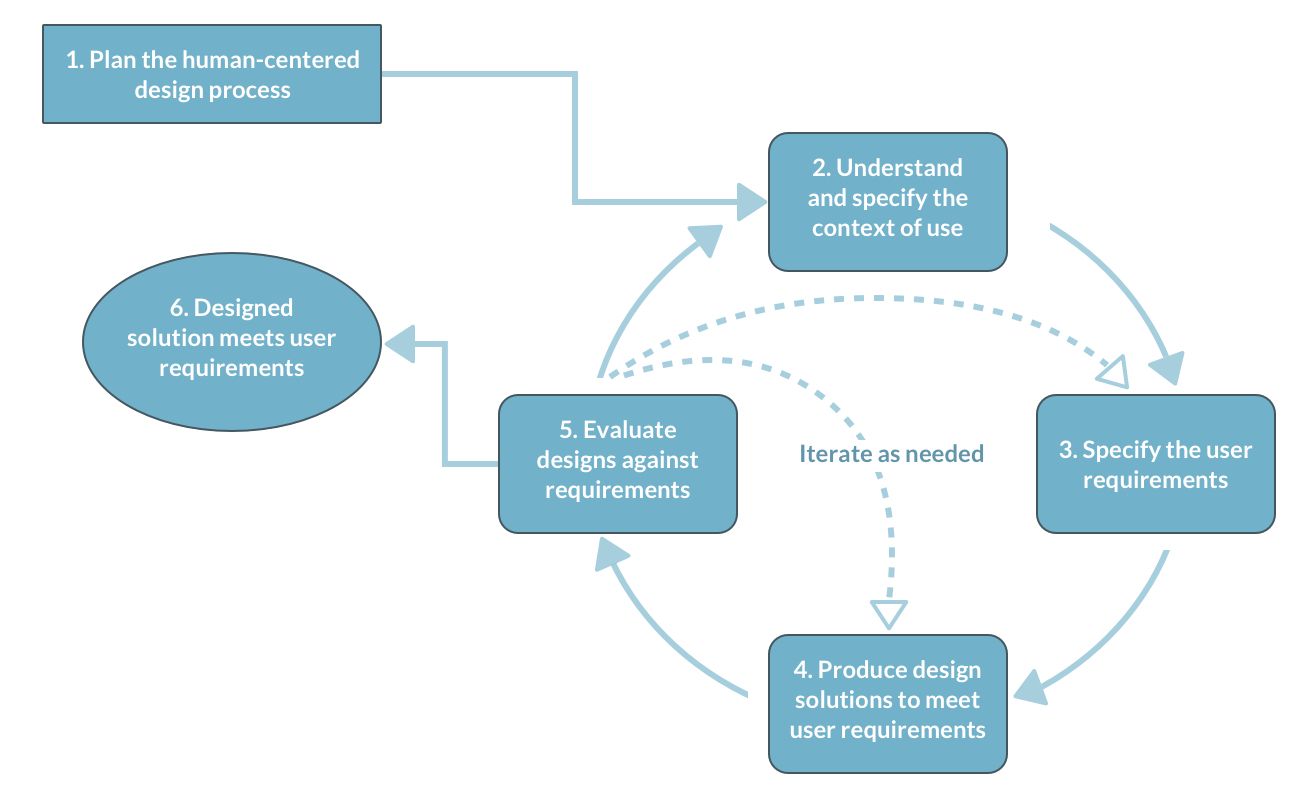
A useful standard for this process is ISO 9241-210 - Human Centered Design for Interactive Systems, which recommends identifying clear goals, incorporating evaluation, and integrating user feedback into an iterative, multi-part cycle.
For Aldrin Lunar, applying this standard meant performing frequent, lightweight tests throughout the design process to ensure that iterations were actually improving the navigation model. In early phases of project work, for instance, the Treejack tool from Optimal Workshop provided a low cost, easily deployable option for getting frequent feedback and evaluating the effects of changes to the concept.
Later in the process we also tested navigation with low fidelity clickable wireframes, which led to further iterations and improvements. Having taken the time to refine the navigation model early on helped streamline these tests and allowed us to focus on how UX and UI decisions were impacting the model. This had a double advantage of allowing us to concentrate on the simple system first, and allowing us to confidently cut down the scope of later prototype testing, which was more expensive to set up and run.
Visual Sitemaps Revisited
The classification scheme and navigation model are not the only simple systems in digital information design work. Depending on the project, one might also create content models, application profiles and custom taxonomies, linked data models, and many other kinds of artifacts. In all cases, the choice to use any (or all) of these approaches stems from a clearly identified problem in need of solving. Any kind of one-size-fits-all laundry list of deliverables is bound to make a project sponsor skeptical—and with good reason.
I likewise don’t use the two “simple system” approaches to delivering information architecture I’ve presented here on every project; not all projects call for them. When I am asked to “deliver a sitemap,” however, these are among the most effective methods I’ve found for making sure that the design work behind the site map actually gets done, and delivering that work in a way that externalizes my and my team’s collective discovery, understanding, and optimization recommendations.
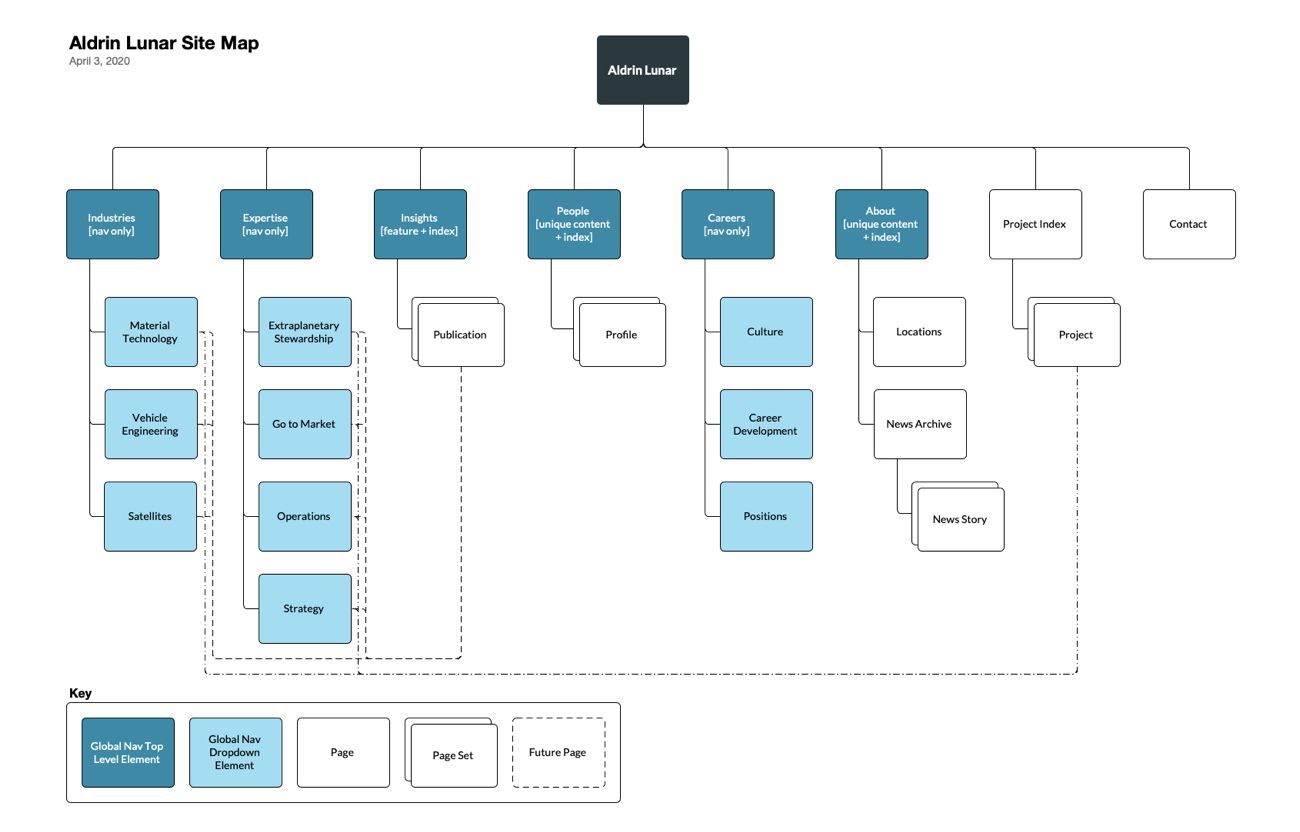
That said, I do also create, present, and deliver visual sitemaps. The sitemap I created for Aldrin Lunar helped socialize recommendations and drive conversations about iterations, improvements, and trade-offs.
The difference between a visual sitemap backed by simple-systems work, and a visual sitemap carrying all the weight of design on its own, however, is profound. In the latter case, there is no available way to disentangle the complex system and engage its constituent parts. The tendency to engage with the arrangement is overwhelming.
Visual Sitemaps & Productive Conversations
When the concepts, rules, and decisions that animate the operation of the system have been worked through and can be readily examined in detail, an informed conversation about the method of arrangement is possible. On the Aldrin Lunar project, for example, one stakeholder, on seeing the visual sitemap, declared that there was no way “projects” (case studies) could be omitted from global navigation. “Projects are what we are—they’re everything we do,” she said.
Because of the principled, standards-based process that led to that design recommendation, instead of arguing over conflicting points of view about the arrangement of that particular piece of content, we were able to discuss how the system as a whole promoted the stakeholder’s goal. For this stakeholder, project case studies are metonymically related to “everything Aldrin Lunar does”; they are a stand-in for the detailed understanding of Aldrin Lunar’s skills and expertise that she knows potential clients can find in those case studies.
Once we pulled this relationship apart, we could all clearly agree that this stakeholder’s interest—clearly communicating Aldrin Lunar’s skills and expertise—is paramount. Then we could productively engage in a principled conversation about which strategy for communicating that content would be most effective, given what we know about how visitors use the site.
In this example, for instance, “project” is a useful category in the classification scheme because it lends itself to better indexing and findability on the part of algorithms, effectively stores content that will be republished in a variety of views across the site, and simplifies the author workflow. It doesn’t, however, necessarily make a good candidate for a global navigation label. Aldrin Lunar website visitors don’t come to the site to read “project case studies”; they come to learn about Aldrin Lunar’s expertise in Exploratory Stewardship, or Go to Market, or Strategy.
This is the rationale for not surfacing the content format “projects” as a menu item, but rather surfacing those case studies in the context of industries and expertise, in order to make the information scent of what the case studies contain stronger. This allows the site to systematically show relevant content to site visitors once they’re communicated some initial information about what they hope to learn (for example, by clicking on “Extraplanetary Stewardship” in the “Expertise” menu).
As a result of this conversation, the project team (including this particular stakeholder) had a better understanding of the method of arrangement created by the interaction of simple systems. This meant we could all then focus on how that method either supported user and business goals—or how we might refine its individual elements to improve its performance as a holistic system.
Delivering IA Purposefully & Intentionally
This way of delivering information architecture may add some new steps to your design process. To some, it may look like unnecessarily drawing out something that’s “really not that complicated.” To be fair, if you truly have a simple digital property—a simple campaign page, or single topic blog—the combination of all its pieces may be simple enough to understand as a composite. Likewise, if you have a digital property that doesn’t have to work as intended on launch, you may be able to iterate toward an effective system by measuring performance and improving iteratively after the fact.
If, however, your digital property serves a critical business, social, or humanitarian function, it is worth taking the time to focus on how its constituent systems work and understand the results their interplay produces. Every website, application, and intranet has an information architecture. Some are created by design; some are created by default. By providing yourself and your team with the tools to focus on important, impactful, and relevant problems, you can help to ensure that the IA you produce is intentional, purposeful, and by design.